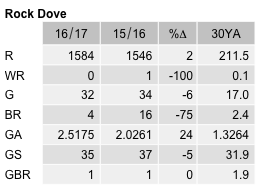
Rock Dove
Columba livia
ABR description
The following is extracted from the Annual Bird Report for the twelve months to June 2017.
Very common, breeding resident
This introduced species is generally restricted to urban areas. There are almost no WOO records.
General: 1592 records compared with 1547 records last year. Abundance is down 19% on last year following a 17% decline on the previous year but up 62% on the 30YA. Reporting rate is down 15% on last year after an 8% drop in the previous year but up 45% on the 30YA. Max 138/11 Mar Mt Ainslie NR – Campbell Park (SmA1), mean 8.6, median 4. 4 breeding records: earliest, nb/4 Aug LTug GrJ16 (HeS1); latest, ne/13 Nov Turner (BoC4).
GBS: There were 687 records compared with 679 last year. Abundance is up 24% on last year and up 90% on the 30YA. Average number sighted 9.4, median 6 with max 62/2wk Jun O’Connor (DoM1). 1 breeding record: di/4wk Jun Curtin (MoM4).
Abundance
Abundance is the average number of birds of that species per survey. Where the species was observed (presence recorded) but the number of birds seen was not recorded, this is treated as a count of zero.
Abundance by year
This chart shows the abundance of Rock Dove between 1982 and 2017. 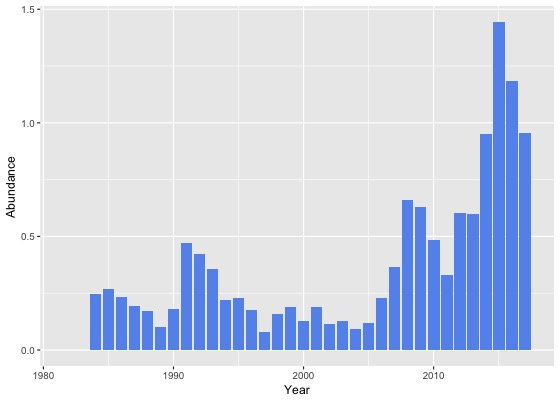
Abundance by month
This chart shows the monthly abundance of Rock Dove. The blue lines show the abundance for the twelve months to June 2017 and the bars show the average abundance for the period 1982 to 2017. 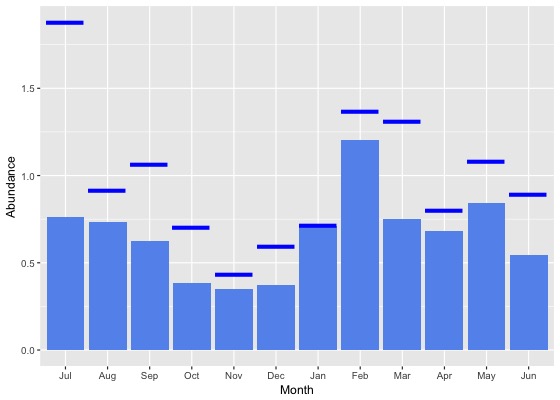
Abundance by season
This chart shows the seasonal abundance of Rock Dove. The blue lines show the seasonal abundance for the twelve months to June 2017 and the bars show the average seasonal abundance for the period 1982 to 2017. 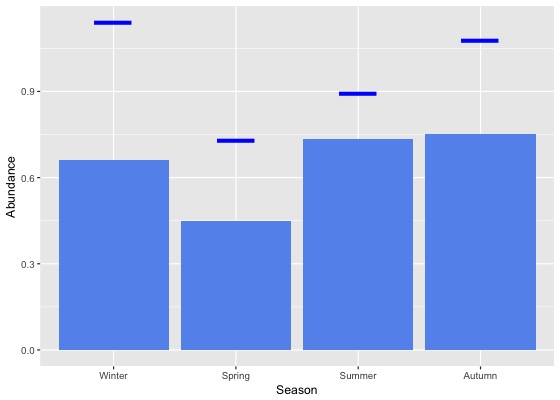
Abundance data
| Month | Season | ||||||||||||||||||
|---|---|---|---|---|---|---|---|---|---|---|---|---|---|---|---|---|---|---|---|
| Period | Jul | Aug | Sep | Oct | Nov | Dec | Jan | Feb | Mar | Apr | May | Jun | Winter | Spring | Summer | Autumn | All | ||
| All years | |||||||||||||||||||
| All | 0.8 | 0.7 | 0.6 | 0.4 | 0.3 | 0.4 | 0.7 | 1.2 | 0.8 | 0.7 | 0.8 | 0.5 | 0.7 | 0.4 | 0.7 | 0.8 | 0.6 | ||
| Previous years | |||||||||||||||||||
| All previous years | 0.6 | 0.7 | 0.6 | 0.3 | 0.3 | 0.3 | 0.7 | 1.2 | 0.7 | 0.7 | 0.8 | 0.5 | 0.6 | 0.4 | 0.7 | 0.7 | 0.6 | ||
| Previous 30 years | 0.6 | 0.7 | 0.6 | 0.3 | 0.3 | 0.3 | 0.7 | 1.2 | 0.7 | 0.7 | 0.8 | 0.5 | 0.6 | 0.4 | 0.7 | 0.7 | 0.6 | ||
| Previous 20 years | 0.7 | 0.9 | 0.7 | 0.4 | 0.4 | 0.4 | 0.8 | 1.3 | 0.7 | 0.8 | 1.0 | 0.5 | 0.7 | 0.5 | 0.8 | 0.8 | 0.7 | ||
| 10 year groups | |||||||||||||||||||
| [2007,2017) | 1.0 | 1.2 | 0.9 | 0.4 | 0.6 | 0.5 | 1.0 | 1.7 | 1.0 | 1.0 | 1.2 | 0.7 | 0.9 | 0.6 | 1.0 | 1.1 | 0.9 | ||
| [1997,2007) | 0.1 | 0.2 | 0.1 | 0.1 | 0.1 | 0.1 | 0.2 | 0.3 | 0.1 | 0.2 | 0.3 | 0.1 | 0.1 | 0.1 | 0.2 | 0.2 | 0.1 | ||
| [1987,1997) | 0.2 | 0.2 | 0.1 | 0.3 | 0.1 | 0.2 | 0.2 | 0.4 | 0.2 | 0.2 | 0.2 | 0.3 | 0.2 | 0.2 | 0.3 | 0.2 | 0.2 | ||
| 5 year groups | |||||||||||||||||||
| [2012,2017) | 1.3 | 1.4 | 0.9 | 0.5 | 0.7 | 0.7 | 1.0 | 1.9 | 1.2 | 1.2 | 1.4 | 1.0 | 1.2 | 0.7 | 1.2 | 1.3 | 1.1 | ||
| [2007,2012) | 0.3 | 0.5 | 1.1 | 0.3 | 0.1 | 0.2 | 0.9 | 1.0 | 0.5 | 0.5 | 0.5 | 0.2 | 0.3 | 0.5 | 0.6 | 0.5 | 0.5 | ||
| [2002,2007) | 0.1 | 0.1 | 0.1 | 0.1 | 0.0 | 0.1 | 0.3 | 0.5 | 0.1 | 0.1 | 0.4 | 0.0 | 0.1 | 0.1 | 0.2 | 0.2 | 0.1 | ||
| [1997,2002) | 0.2 | 0.3 | 0.2 | 0.2 | 0.1 | 0.1 | 0.2 | 0.1 | 0.1 | 0.2 | 0.3 | 0.1 | 0.2 | 0.2 | 0.1 | 0.2 | 0.2 | ||
| [1992,1997) | 0.4 | 0.4 | 0.2 | 0.4 | 0.2 | 0.2 | 0.2 | 0.2 | 0.1 | 0.2 | 0.4 | 0.3 | 0.4 | 0.3 | 0.2 | 0.2 | 0.3 | ||
| [1987,1992) | 0.1 | 0.1 | 0.1 | 0.2 | 0.1 | 0.2 | 0.1 | 0.5 | 0.2 | 0.2 | 0.2 | 0.2 | 0.2 | 0.1 | 0.3 | 0.2 | 0.2 | ||
| Year | |||||||||||||||||||
| 2017 | 1.9 | 0.9 | 1.1 | 0.7 | 0.4 | 0.6 | 0.7 | 1.4 | 1.3 | 0.8 | 1.1 | 0.9 | 1.1 | 0.7 | 0.9 | 1.1 | 1.0 | ||
| 2016 | 1.4 | 1.1 | 1.0 | 0.6 | 1.0 | 0.9 | 1.4 | 1.6 | 1.4 | 1.0 | 1.4 | 1.4 | 1.3 | 0.9 | 1.3 | 1.3 | 1.2 | ||
| 2015 | 1.4 | 1.9 | 1.2 | 0.6 | 0.5 | 1.1 | 1.4 | 2.7 | 1.9 | 2.1 | 1.7 | 1.2 | 1.4 | 0.8 | 1.7 | 1.9 | 1.4 | ||
| 2014 | 2.0 | 0.9 | 0.4 | 0.6 | 0.5 | 0.1 | 0.6 | 2.5 | 1.3 | 0.8 | 1.9 | 0.8 | 1.1 | 0.5 | 1.0 | 1.3 | 1.0 | ||
| 2013 | 1.0 | 1.1 | 0.2 | 0.2 | 0.6 | 0.3 | 0.4 | 1.2 | 0.6 | 1.2 | 1.0 | 0.3 | 0.8 | 0.3 | 0.5 | 0.9 | 0.6 | ||
| 2012 | 0.7 | 2.2 | 0.9 | 0.3 | 0.8 | 0.5 | 0.7 | 0.6 | 0.1 | 0.3 | 0.8 | 0.3 | 1.0 | 0.6 | 0.6 | 0.3 | 0.6 | ||
| 2011 | 0.6 | 0.2 | 0.1 | 0.2 | 0.3 | 0.1 | 0.4 | 1.1 | 0.7 | 0.0 | 0.3 | 0.4 | 0.4 | 0.2 | 0.4 | 0.3 | 0.3 | ||
| 2010 | 0.0 | 1.2 | 1.9 | 0.4 | 0.0 | 0.1 | 0.2 | 0.9 | 0.5 | 0.4 | 0.6 | 0.0 | 0.3 | 0.7 | 0.3 | 0.5 | 0.5 | ||
| 2009 | 0.8 | 1.1 | 1.1 | 0.2 | 0.1 | 0.0 | 3.0 | 0.8 | 0.6 | 0.8 | 0.2 | 0.4 | 0.7 | 0.4 | 1.2 | 0.6 | 0.6 | ||
| 2008 | 0.0 | 0.0 | 1.8 | 0.4 | 0.2 | 0.2 | 1.2 | 2.0 | 0.4 | 0.9 | 1.2 | 0.1 | 0.0 | 0.8 | 0.9 | 0.8 | 0.7 | ||
| 2007 | 0.0 | 0.2 | 0.5 | 0.2 | 0.0 | 0.4 | 0.9 | 0.5 | 0.1 | 0.3 | 0.7 | 0.3 | 0.2 | 0.2 | 0.6 | 0.3 | 0.4 | ||
| 2006 | 0.0 | 0.1 | 0.0 | 0.3 | 0.2 | 0.0 | 0.4 | 0.6 | 0.1 | 0.1 | 1.5 | 0.0 | 0.0 | 0.2 | 0.3 | 0.4 | 0.2 | ||
| 2005 | 0.1 | 0.1 | 0.1 | 0.0 | 0.0 | 0.0 | 0.4 | 0.9 | 0.1 | 0.1 | 0.0 | 0.0 | 0.1 | 0.1 | 0.3 | 0.1 | 0.1 | ||
| 2004 | 0.2 | 0.2 | 0.1 | 0.0 | 0.0 | 0.0 | 0.1 | 0.3 | 0.1 | 0.1 | 0.0 | 0.0 | 0.1 | 0.0 | 0.1 | 0.1 | 0.1 | ||
| 2003 | 0.2 | 0.1 | 0.0 | 0.0 | 0.1 | 0.2 | 0.1 | 0.9 | 0.0 | 0.1 | 0.0 | 0.0 | 0.1 | 0.0 | 0.4 | 0.0 | 0.1 | ||
| 2002 | 0.0 | 0.1 | 0.1 | 0.1 | 0.0 | 0.1 | 0.3 | 0.1 | 0.0 | 0.2 | 0.3 | 0.1 | 0.1 | 0.1 | 0.2 | 0.2 | 0.1 | ||
| 2001 | 0.3 | 0.3 | 0.2 | 0.1 | 0.1 | 0.1 | 0.3 | 0.2 | 0.2 | 0.4 | 0.2 | 0.1 | 0.2 | 0.1 | 0.2 | 0.2 | 0.2 | ||
| 2000 | 0.1 | 0.3 | 0.3 | 0.3 | 0.2 | 0.1 | 0.1 | 0.0 | 0.1 | 0.0 | 0.1 | 0.0 | 0.1 | 0.2 | 0.1 | 0.1 | 0.1 | ||
| 1999 | 0.1 | 0.3 | 0.1 | 0.3 | 0.0 | 0.0 | 0.1 | 0.2 | 0.2 | 0.3 | 0.5 | 0.2 | 0.2 | 0.1 | 0.1 | 0.3 | 0.2 | ||
| 1998 | 0.4 | 0.4 | 0.1 | 0.1 | 0.0 | 0.0 | 0.6 | 0.0 | 0.0 | 0.2 | 1.1 | 0.0 | 0.2 | 0.1 | 0.2 | 0.2 | 0.2 | ||
| 1997 | 0.1 | 0.0 | 0.0 | 0.1 | 0.1 | 0.2 | 0.1 | 0.0 | 0.1 | 0.2 | 0.0 | 0.0 | 0.0 | 0.1 | 0.1 | 0.1 | 0.1 | ||
| 1996 | 0.2 | 0.3 | 0.1 | 0.2 | 0.0 | 0.1 | 0.3 | 0.2 | 0.1 | 0.2 | 0.4 | 0.1 | 0.2 | 0.1 | 0.2 | 0.2 | 0.2 | ||
| 1995 | 0.2 | 0.3 | 0.1 | 0.7 | 0.1 | 0.0 | 0.0 | 0.3 | 0.2 | 0.4 | 0.1 | 0.1 | 0.2 | 0.4 | 0.1 | 0.2 | 0.2 | ||
| 1994 | 0.2 | 0.5 | 0.0 | 0.3 | 0.1 | 0.2 | 0.3 | 0.2 | 0.1 | 0.1 | 0.8 | 0.0 | 0.2 | 0.1 | 0.2 | 0.3 | 0.2 | ||
| 1993 | 0.9 | 0.5 | 0.2 | 0.4 | 0.4 | 0.2 | 0.2 | 0.5 | 0.0 | 0.1 | 0.1 | 0.9 | 0.8 | 0.3 | 0.3 | 0.1 | 0.4 | ||
| 1992 | 0.6 | 0.3 | 0.3 | 0.3 | 0.6 | 0.4 | 0.2 | 0.0 | 0.3 | 0.3 | 0.7 | 1.0 | 0.6 | 0.4 | 0.2 | 0.4 | 0.4 | ||
| 1991 | 0.2 | 0.3 | 0.1 | 0.6 | 0.2 | 0.3 | 0.3 | 1.6 | 1.2 | 0.7 | 0.2 | 0.8 | 0.4 | 0.3 | 0.7 | 0.7 | 0.5 | ||
| 1990 | 0.1 | 0.1 | 0.1 | 0.1 | 0.1 | 0.1 | 0.3 | 0.0 | 0.0 | 0.5 | 0.6 | 0.6 | 0.2 | 0.1 | 0.1 | 0.4 | 0.2 | ||
| 1989 | 0.1 | 0.1 | 0.1 | 0.1 | 0.1 | 0.1 | 0.1 | 0.2 | 0.1 | 0.1 | 0.1 | 0.1 | 0.1 | 0.1 | 0.1 | 0.1 | 0.1 | ||
| 1988 | 0.1 | 0.1 | 0.1 | 0.1 | 0.1 | 0.5 | 0.1 | 0.7 | 0.1 | 0.1 | 0.1 | 0.1 | 0.1 | 0.1 | 0.4 | 0.1 | 0.2 | ||
| 1987 | 0.0 | 0.2 | 0.2 | 0.2 | 0.1 | 0.2 | 0.2 | 0.4 | 0.1 | 0.2 | 0.1 | 0.2 | 0.2 | 0.2 | 0.3 | 0.1 | 0.2 | ||
| 1986 | 0.0 | 0.4 | 0.0 | 0.1 | 0.0 | 0.4 | 0.0 | 0.8 | 0.0 | 0.6 | 0.0 | 0.3 | 0.3 | 0.0 | 0.5 | 0.3 | 0.2 | ||
| 1985 | 0.0 | 0.1 | 0.0 | 0.1 | 0.1 | 0.1 | 0.0 | 2.4 | 0.6 | 0.5 | 0.0 | 1.1 | 0.4 | 0.1 | 0.6 | 0.4 | 0.3 | ||
| 1984 | 0.0 | 0.0 | 0.0 | 0.0 | 0.0 | 0.0 | 0.0 | 0.0 | 0.0 | 0.2 | 0.0 | 1.5 | 1.0 | 0.0 | 0.0 | 0.1 | 0.2 | ||
| 1983 | 0.0 | 0.0 | 0.0 | 0.0 | 0.0 | 0.0 | 0.0 | 0.0 | 0.0 | - | 0.0 | 0.0 | 0.0 | 0.0 | 0.0 | 0.0 | 0.0 | ||
| 1982 | - | 0.0 | - | 0.0 | 0.0 | 0.0 | - | 0.0 | - | 0.0 | - | 0.0 | 0.0 | 0.0 | 0.0 | 0.0 | 0.0 | ||
Reporting rates
Reporting rate is the proportion of all surveys in which the species was present.
Reporting rate by year
This chart shows the reporting rate of Rock Dove each year between 1982 and 2017. 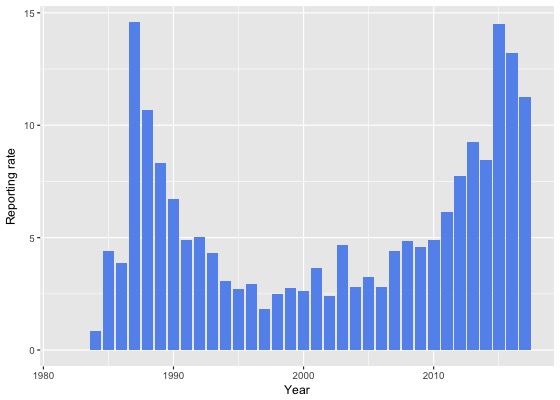
Reporting rate by month
This chart shows the reporting rate by month of Rock Dove. The blue lines show the reporting rate for the twelve months to June 2017 and the bars show the average reporting rate for the period 1982 to 2017. 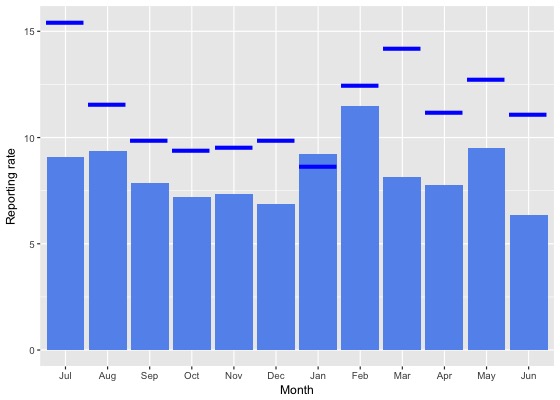
Reporting rate by season
This chart shows the seasonal reporting rate of Rock Dove. The blue lines show the seasonal reporting rate for the twelve months to June 2017 and the bars show the average seasonal reporting rate for the period 1982 to 2017. 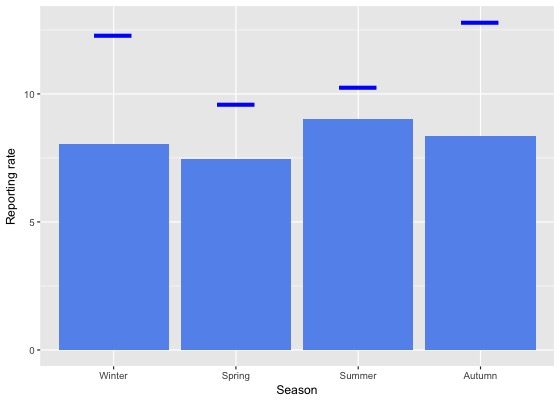
Reporting rate data
| Month | Season | ||||||||||||||||||
|---|---|---|---|---|---|---|---|---|---|---|---|---|---|---|---|---|---|---|---|
| Period | Jul | Aug | Sep | Oct | Nov | Dec | Jan | Feb | Mar | Apr | May | Jun | Winter | Spring | Summer | Autumn | All | ||
| All years | |||||||||||||||||||
| All | 9.1 | 9.4 | 7.9 | 7.2 | 7.3 | 6.9 | 9.2 | 11.5 | 8.1 | 7.8 | 9.5 | 6.3 | 8.0 | 7.5 | 9.0 | 8.4 | 8.2 | ||
| Previous years | |||||||||||||||||||
| All previous years | 8.1 | 9.0 | 7.6 | 6.9 | 7.0 | 6.4 | 9.3 | 11.3 | 7.0 | 7.2 | 8.8 | 5.4 | 7.3 | 7.1 | 8.8 | 7.5 | 7.7 | ||
| Previous 30 years | 8.2 | 9.1 | 7.7 | 7.0 | 7.1 | 6.5 | 9.4 | 11.3 | 7.1 | 7.2 | 8.9 | 5.4 | 7.3 | 7.2 | 8.9 | 7.6 | 7.8 | ||
| Previous 20 years | 8.5 | 9.7 | 7.6 | 6.6 | 7.1 | 5.9 | 9.6 | 11.8 | 7.0 | 7.1 | 9.5 | 5.3 | 7.5 | 7.0 | 8.9 | 7.7 | 7.8 | ||
| 10 year groups | |||||||||||||||||||
| [2007,2017) | 11.8 | 12.0 | 10.0 | 7.6 | 9.4 | 8.1 | 11.2 | 14.2 | 9.3 | 8.6 | 11.9 | 7.0 | 9.7 | 8.7 | 11.0 | 9.7 | 9.7 | ||
| [1997,2007) | 2.8 | 4.7 | 2.7 | 3.0 | 2.6 | 1.8 | 4.2 | 5.7 | 2.2 | 3.3 | 3.9 | 1.8 | 2.9 | 2.8 | 3.6 | 3.0 | 3.0 | ||
| [1987,1997) | 7.2 | 7.1 | 8.4 | 9.5 | 7.1 | 9.3 | 8.4 | 8.7 | 7.4 | 7.6 | 6.6 | 6.0 | 6.8 | 8.3 | 8.8 | 7.2 | 7.8 | ||
| 5 year groups | |||||||||||||||||||
| [2012,2017) | 14.5 | 14.4 | 12.4 | 9.3 | 11.6 | 9.3 | 11.6 | 15.9 | 11.1 | 10.4 | 13.7 | 9.2 | 12.3 | 10.8 | 12.1 | 11.5 | 11.6 | ||
| [2007,2012) | 4.0 | 3.6 | 4.5 | 4.7 | 3.4 | 5.6 | 10.0 | 7.0 | 4.3 | 4.7 | 6.6 | 3.0 | 3.4 | 4.4 | 7.4 | 5.0 | 5.0 | ||
| [2002,2007) | 2.6 | 4.2 | 2.8 | 2.9 | 2.4 | 1.8 | 5.0 | 8.6 | 2.3 | 3.8 | 3.7 | 1.2 | 2.4 | 2.7 | 4.4 | 3.1 | 3.2 | ||
| [1997,2002) | 3.1 | 5.3 | 2.6 | 3.2 | 2.7 | 1.9 | 3.3 | 2.8 | 2.0 | 2.6 | 4.1 | 2.7 | 3.6 | 2.8 | 2.6 | 2.7 | 2.9 | ||
| [1992,1997) | 4.3 | 5.1 | 2.5 | 4.1 | 3.0 | 2.9 | 3.3 | 5.4 | 1.8 | 3.4 | 3.5 | 2.5 | 4.0 | 3.3 | 3.8 | 2.9 | 3.5 | ||
| [1987,1992) | 8.5 | 8.2 | 11.2 | 12.4 | 9.1 | 12.1 | 11.1 | 10.0 | 10.8 | 10.0 | 8.1 | 7.9 | 8.2 | 10.8 | 11.1 | 9.7 | 10.0 | ||
| Year | |||||||||||||||||||
| 2017 | 15.4 | 11.5 | 9.9 | 9.4 | 9.5 | 9.9 | 8.7 | 12.4 | 14.2 | 11.2 | 12.7 | 11.1 | 12.3 | 9.6 | 10.3 | 12.8 | 11.2 | ||
| 2016 | 18.1 | 14.8 | 15.2 | 12.1 | 15.5 | 12.2 | 12.9 | 14.0 | 12.3 | 10.0 | 12.6 | 12.2 | 14.9 | 14.0 | 13.1 | 11.5 | 13.2 | ||
| 2015 | 15.9 | 21.0 | 17.1 | 11.6 | 10.9 | 12.3 | 12.3 | 20.3 | 13.9 | 14.1 | 18.4 | 11.7 | 15.4 | 13.1 | 14.7 | 15.2 | 14.5 | ||
| 2014 | 13.3 | 10.9 | 6.2 | 8.0 | 7.4 | 2.5 | 8.4 | 13.8 | 8.7 | 5.9 | 14.0 | 5.7 | 8.9 | 7.4 | 8.8 | 9.0 | 8.5 | ||
| 2013 | 7.3 | 6.3 | 7.0 | 5.4 | 7.4 | 6.9 | 11.6 | 18.5 | 11.1 | 13.0 | 11.7 | 5.8 | 6.4 | 6.4 | 11.3 | 11.9 | 9.3 | ||
| 2012 | 10.3 | 11.4 | 8.3 | 5.7 | 11.7 | 5.4 | 11.4 | 11.2 | 4.2 | 5.5 | 7.0 | 3.9 | 8.1 | 7.8 | 9.4 | 5.3 | 7.8 | ||
| 2011 | 7.3 | 1.6 | 1.6 | 2.6 | 2.4 | 12.2 | 13.3 | 6.8 | 5.3 | 4.1 | 7.3 | 5.8 | 5.2 | 2.3 | 11.3 | 5.5 | 6.1 | ||
| 2010 | 2.1 | 3.5 | 9.7 | 5.7 | 1.9 | 4.0 | 9.2 | 10.6 | 2.0 | 4.3 | 2.9 | 2.3 | 2.5 | 6.0 | 6.9 | 3.0 | 4.9 | ||
| 2009 | 7.2 | 8.3 | 4.9 | 3.7 | 4.0 | 1.1 | 12.0 | 7.5 | 2.8 | 3.7 | 5.3 | 2.3 | 5.0 | 4.1 | 6.3 | 3.7 | 4.6 | ||
| 2008 | 0.0 | 0.9 | 3.0 | 6.9 | 2.7 | 2.3 | 9.5 | 8.3 | 5.9 | 7.1 | 6.3 | 1.9 | 1.1 | 5.2 | 5.7 | 6.6 | 4.9 | ||
| 2007 | 3.3 | 4.6 | 3.3 | 4.5 | 6.1 | 5.0 | 5.1 | 2.6 | 5.5 | 3.4 | 9.8 | 1.6 | 2.6 | 4.5 | 4.6 | 5.6 | 4.4 | ||
| 2006 | 1.3 | 4.9 | 0.9 | 3.6 | 3.6 | 0.0 | 6.2 | 6.7 | 2.6 | 2.2 | 4.3 | 0.4 | 1.6 | 2.8 | 4.1 | 2.9 | 2.8 | ||
| 2005 | 2.2 | 3.7 | 2.2 | 1.7 | 0.7 | 0.8 | 8.5 | 5.4 | 3.5 | 6.6 | 5.5 | 1.5 | 2.2 | 1.7 | 3.9 | 5.0 | 3.2 | ||
| 2004 | 4.8 | 2.0 | 3.4 | 2.9 | 1.2 | 2.3 | 2.4 | 7.1 | 1.6 | 3.3 | 1.9 | 1.2 | 3.0 | 2.5 | 3.3 | 2.3 | 2.8 | ||
| 2003 | 2.6 | 5.0 | 5.1 | 2.1 | 4.6 | 3.4 | 4.4 | 18.1 | 2.2 | 4.1 | 1.6 | 1.9 | 3.1 | 4.0 | 8.5 | 2.8 | 4.7 | ||
| 2002 | 1.1 | 5.9 | 2.5 | 3.4 | 1.5 | 2.1 | 3.8 | 2.0 | 1.4 | 3.0 | 3.5 | 1.1 | 2.3 | 2.5 | 2.5 | 2.3 | 2.4 | ||
| 2001 | 3.1 | 6.6 | 3.9 | 3.4 | 3.4 | 4.0 | 4.5 | 3.1 | 3.0 | 3.9 | 4.0 | 2.0 | 3.7 | 3.6 | 3.9 | 3.5 | 3.7 | ||
| 2000 | 1.6 | 5.9 | 2.8 | 4.0 | 3.7 | 1.3 | 2.9 | 2.4 | 1.2 | 2.2 | 1.8 | 2.7 | 3.4 | 3.5 | 2.1 | 1.7 | 2.6 | ||
| 1999 | 5.9 | 5.2 | 1.1 | 3.8 | 1.9 | 0.0 | 1.5 | 3.6 | 2.2 | 0.5 | 5.7 | 4.7 | 4.9 | 2.3 | 1.6 | 2.7 | 2.7 | ||
| 1998 | 8.1 | 5.7 | 2.4 | 1.1 | 1.8 | 0.0 | 5.9 | 1.9 | 0.0 | 7.7 | 7.4 | 0.0 | 3.6 | 1.8 | 2.2 | 3.1 | 2.5 | ||
| 1997 | 2.3 | 0.0 | 0.9 | 1.3 | 1.7 | 2.9 | 2.0 | 1.8 | 2.5 | 2.8 | 2.2 | 1.4 | 1.4 | 1.3 | 2.4 | 2.6 | 1.8 | ||
| 1996 | 3.0 | 4.3 | 1.3 | 2.6 | 0.0 | 3.0 | 6.8 | 2.4 | 2.0 | 3.1 | 3.4 | 3.4 | 3.6 | 1.3 | 4.2 | 2.7 | 2.9 | ||
| 1995 | 2.2 | 3.9 | 2.9 | 4.3 | 0.9 | 0.0 | 0.9 | 7.9 | 3.1 | 4.0 | 1.3 | 1.1 | 2.5 | 2.9 | 2.3 | 3.0 | 2.7 | ||
| 1994 | 2.0 | 7.8 | 1.5 | 3.5 | 2.9 | 4.3 | 2.9 | 6.9 | 1.1 | 1.5 | 3.8 | 1.1 | 3.7 | 2.8 | 4.7 | 2.0 | 3.1 | ||
| 1993 | 8.2 | 5.1 | 1.6 | 6.7 | 9.1 | 2.2 | 4.1 | 6.2 | 0.0 | 6.7 | 1.3 | 2.9 | 5.1 | 5.9 | 3.9 | 2.3 | 4.3 | ||
| 1992 | 7.7 | 5.6 | 4.7 | 4.3 | 5.6 | 6.3 | 1.7 | 4.9 | 2.8 | 3.4 | 7.9 | 5.0 | 6.1 | 4.8 | 4.3 | 4.9 | 5.0 | ||
| 1991 | 5.5 | 4.3 | 1.2 | 4.9 | 2.1 | 4.1 | 3.6 | 8.0 | 11.1 | 5.1 | 6.6 | 6.0 | 5.2 | 2.8 | 5.0 | 7.7 | 4.9 | ||
| 1990 | 8.4 | 6.5 | 8.6 | 8.2 | 5.6 | 5.6 | 18.1 | 4.2 | 1.1 | 2.4 | 6.8 | 5.3 | 7.0 | 7.4 | 9.3 | 3.3 | 6.7 | ||
| 1989 | 10.2 | 9.9 | 8.7 | 7.3 | 10.1 | 7.4 | 8.0 | 8.2 | 8.9 | 7.7 | 6.6 | 6.5 | 9.1 | 8.6 | 7.8 | 7.8 | 8.3 | ||
| 1988 | 8.6 | 9.3 | 13.5 | 12.5 | 6.9 | 14.4 | 9.5 | 12.6 | 11.9 | 13.9 | 8.6 | 9.2 | 9.1 | 10.5 | 12.1 | 11.4 | 10.7 | ||
| 1987 | 9.1 | 6.7 | 16.2 | 22.3 | 13.4 | 20.4 | 15.4 | 11.7 | 15.3 | 12.8 | 9.6 | 9.3 | 9.1 | 16.9 | 15.6 | 12.5 | 14.6 | ||
| 1986 | 3.8 | 5.3 | 0.0 | 5.6 | 0.0 | 2.9 | 0.0 | 19.4 | 0.0 | 5.9 | 0.0 | 2.9 | 4.0 | 1.5 | 8.6 | 2.7 | 3.9 | ||
| 1985 | 0.0 | 6.7 | 1.9 | 1.2 | 1.8 | 5.0 | 0.0 | 23.5 | 9.1 | 10.5 | 0.0 | 10.7 | 5.7 | 1.5 | 8.2 | 7.5 | 4.4 | ||
| 1984 | 0.0 | 0.0 | 0.0 | 0.0 | 0.0 | 0.0 | 0.0 | 0.0 | 0.0 | 2.9 | 0.0 | 2.9 | 2.0 | 0.0 | 0.0 | 1.1 | 0.8 | ||
| 1983 | 0.0 | 0.0 | 0.0 | 0.0 | 0.0 | 0.0 | 0.0 | 0.0 | 0.0 | - | 0.0 | 0.0 | 0.0 | 0.0 | 0.0 | 0.0 | 0.0 | ||
| 1982 | - | 0.0 | - | 0.0 | 0.0 | 0.0 | - | 0.0 | - | 0.0 | - | 0.0 | 0.0 | 0.0 | 0.0 | 0.0 | 0.0 | ||
Breeding data
Breeding records by month
Number of breeding records by breeding code and month, 2017 and all years| Breeding code | Jul | Aug | Sep | Oct | Nov | Dec | Jan | Feb | Mar | Apr | May | Jun |
|---|---|---|---|---|---|---|---|---|---|---|---|---|
| 2017 | ||||||||||||
| Breeding (BLA code) | 0 | 0 | 0 | 0 | 0 | 0 | 0 | 0 | 0 | 0 | 0 | 0 |
| Carrying Food | 0 | 0 | 0 | 0 | 0 | 0 | 0 | 0 | 0 | 0 | 0 | 0 |
| Copulating | 0 | 0 | 0 | 0 | 0 | 0 | 0 | 0 | 0 | 0 | 0 | 0 |
| Display | 0 | 0 | 0 | 1 | 0 | 0 | 0 | 0 | 0 | 0 | 0 | 0 |
| Dependent young | 0 | 0 | 0 | 0 | 0 | 0 | 0 | 0 | 0 | 0 | 0 | 0 |
| Faecal sac | 0 | 0 | 0 | 0 | 0 | 0 | 0 | 0 | 0 | 0 | 0 | 0 |
| Inspecting hollow | 0 | 0 | 0 | 0 | 0 | 0 | 0 | 0 | 0 | 0 | 0 | 0 |
| Nest building | 0 | 1 | 0 | 0 | 0 | 0 | 0 | 0 | 0 | 0 | 0 | 0 |
| Nest with eggs | 0 | 0 | 0 | 0 | 2 | 0 | 0 | 0 | 0 | 0 | 0 | 0 |
| Nest with young | 0 | 0 | 0 | 0 | 0 | 0 | 0 | 0 | 0 | 0 | 0 | 0 |
| On/leaving nest | 0 | 0 | 0 | 0 | 0 | 0 | 0 | 0 | 0 | 0 | 0 | 0 |
| All years | ||||||||||||
| Breeding (BLA code) | 0 | 0 | 0 | 0 | 0 | 1 | 2 | 0 | 0 | 2 | 0 | 0 |
| Carrying Food | 0 | 0 | 0 | 0 | 0 | 0 | 0 | 0 | 0 | 0 | 0 | 0 |
| Copulating | 0 | 1 | 1 | 0 | 0 | 0 | 0 | 0 | 0 | 0 | 0 | 0 |
| Display | 0 | 1 | 0 | 8 | 0 | 0 | 0 | 0 | 0 | 0 | 0 | 0 |
| Dependent young | 1 | 0 | 0 | 0 | 1 | 1 | 2 | 0 | 1 | 0 | 0 | 0 |
| Faecal sac | 0 | 0 | 0 | 0 | 0 | 0 | 0 | 0 | 0 | 0 | 0 | 0 |
| Inspecting hollow | 0 | 0 | 0 | 0 | 0 | 0 | 0 | 0 | 0 | 0 | 0 | 0 |
| Nest building | 0 | 4 | 2 | 4 | 1 | 2 | 0 | 0 | 0 | 0 | 0 | 1 |
| Nest with eggs | 2 | 0 | 3 | 5 | 3 | 0 | 1 | 0 | 0 | 0 | 0 | 0 |
| Nest with young | 0 | 0 | 1 | 4 | 6 | 3 | 0 | 0 | 0 | 2 | 1 | 1 |
| On/leaving nest | 0 | 0 | 1 | 3 | 1 | 0 | 0 | 2 | 0 | 0 | 0 | 0 |
Breeding records by year
Average number of breeding records per period by breeding code| Period | Breeding (BLA code) | Carrying Food | Copulating | Display | Dependent young | Faecal sac | Inspecting hollow | Nest building | Nest with eggs | Nest with young | On/leaving nest |
|---|---|---|---|---|---|---|---|---|---|---|---|
| All years | |||||||||||
| All | 0.1 | 0.0 | 0.1 | 0.2 | 0.2 | 0.0 | 0.0 | 0.4 | 0.4 | 0.5 | 0.2 |
| Previous years | |||||||||||
| All previous years | 0.1 | 0.0 | 0.1 | 0.2 | 0.2 | 0.0 | 0.0 | 0.4 | 0.3 | 0.5 | 0.2 |
| Previous 30 years | 0.2 | 0.0 | 0.1 | 0.3 | 0.2 | 0.0 | 0.0 | 0.4 | 0.4 | 0.6 | 0.2 |
| Previous 20 years | 0.2 | 0.0 | 0.1 | 0.3 | 0.2 | 0.0 | 0.0 | 0.2 | 0.0 | 0.3 | 0.3 |
| 10 year groups | |||||||||||
| [2007,2017) | 0.5 | 0.0 | 0.0 | 0.7 | 0.5 | 0.0 | 0.0 | 0.3 | 0.1 | 0.7 | 0.6 |
| [1997,2007) | 0.0 | 0.0 | 0.2 | 0.0 | 0.0 | 0.0 | 0.0 | 0.1 | 0.0 | 0.0 | 0.0 |
| [1987,1997) | 0.0 | 0.0 | 0.0 | 0.1 | 0.1 | 0.0 | 0.0 | 0.9 | 1.1 | 1.1 | 0.1 |
| 5 year groups | |||||||||||
| [2012,2017) | 1.0 | 0.0 | 0.0 | 1.4 | 0.8 | 0.0 | 0.0 | 0.4 | 0.2 | 1.2 | 1.2 |
| [2007,2012) | 0.0 | 0.0 | 0.0 | 0.0 | 0.2 | 0.0 | 0.0 | 0.2 | 0.0 | 0.2 | 0.0 |
| [2002,2007) | 0.0 | 0.0 | 0.2 | 0.0 | 0.0 | 0.0 | 0.0 | 0.2 | 0.0 | 0.0 | 0.0 |
| [1997,2002) | 0.0 | 0.0 | 0.2 | 0.0 | 0.0 | 0.0 | 0.0 | 0.0 | 0.0 | 0.0 | 0.0 |
| [1992,1997) | 0.0 | 0.0 | 0.0 | 0.2 | 0.0 | 0.0 | 0.0 | 0.2 | 0.0 | 0.2 | 0.2 |
| [1987,1992) | 0.0 | 0.0 | 0.0 | 0.0 | 0.2 | 0.0 | 0.0 | 1.6 | 2.2 | 2.0 | 0.0 |
| Year | |||||||||||
| 2017 | 0.0 | 0.0 | 0.0 | 1.0 | 0.0 | 0.0 | 0.0 | 1.0 | 2.0 | 0.0 | 0.0 |
| 2016 | 2.0 | 0.0 | 0.0 | 3.0 | 2.0 | 0.0 | 0.0 | 1.0 | 1.0 | 4.0 | 3.0 |
| 2015 | 0.0 | 0.0 | 0.0 | 2.0 | 2.0 | 0.0 | 0.0 | 1.0 | 0.0 | 2.0 | 2.0 |
| 2014 | 0.0 | 0.0 | 0.0 | 2.0 | 0.0 | 0.0 | 0.0 | 0.0 | 0.0 | 0.0 | 0.0 |
| 2013 | 2.0 | 0.0 | 0.0 | 0.0 | 0.0 | 0.0 | 0.0 | 0.0 | 0.0 | 0.0 | 1.0 |
| 2012 | 1.0 | 0.0 | 0.0 | 0.0 | 0.0 | 0.0 | 0.0 | 0.0 | 0.0 | 0.0 | 0.0 |
| 2011 | 0.0 | 0.0 | 0.0 | 0.0 | 0.0 | 0.0 | 0.0 | 0.0 | 0.0 | 0.0 | 0.0 |
| 2010 | 0.0 | 0.0 | 0.0 | 0.0 | 0.0 | 0.0 | 0.0 | 0.0 | 0.0 | 0.0 | 0.0 |
| 2009 | 0.0 | 0.0 | 0.0 | 0.0 | 0.0 | 0.0 | 0.0 | 0.0 | 0.0 | 0.0 | 0.0 |
| 2008 | 0.0 | 0.0 | 0.0 | 0.0 | 0.0 | 0.0 | 0.0 | 0.0 | 0.0 | 1.0 | 0.0 |
| 2007 | 0.0 | 0.0 | 0.0 | 0.0 | 1.0 | 0.0 | 0.0 | 1.0 | 0.0 | 0.0 | 0.0 |
| 2006 | 0.0 | 0.0 | 1.0 | 0.0 | 0.0 | 0.0 | 0.0 | 0.0 | 0.0 | 0.0 | 0.0 |
| 2005 | 0.0 | 0.0 | 0.0 | 0.0 | 0.0 | 0.0 | 0.0 | 0.0 | 0.0 | 0.0 | 0.0 |
| 2004 | 0.0 | 0.0 | 0.0 | 0.0 | 0.0 | 0.0 | 0.0 | 0.0 | 0.0 | 0.0 | 0.0 |
| 2003 | 0.0 | 0.0 | 0.0 | 0.0 | 0.0 | 0.0 | 0.0 | 1.0 | 0.0 | 0.0 | 0.0 |
| 2002 | 0.0 | 0.0 | 0.0 | 0.0 | 0.0 | 0.0 | 0.0 | 0.0 | 0.0 | 0.0 | 0.0 |
| 2001 | 0.0 | 0.0 | 0.0 | 0.0 | 0.0 | 0.0 | 0.0 | 0.0 | 0.0 | 0.0 | 0.0 |
| 2000 | 0.0 | 0.0 | 1.0 | 0.0 | 0.0 | 0.0 | 0.0 | 0.0 | 0.0 | 0.0 | 0.0 |
| 1999 | 0.0 | 0.0 | 0.0 | 0.0 | 0.0 | 0.0 | 0.0 | 0.0 | 0.0 | 0.0 | 0.0 |
| 1998 | 0.0 | 0.0 | 0.0 | 0.0 | 0.0 | 0.0 | 0.0 | 0.0 | 0.0 | 0.0 | 0.0 |
| 1997 | 0.0 | 0.0 | 0.0 | 0.0 | 0.0 | 0.0 | 0.0 | 0.0 | 0.0 | 0.0 | 0.0 |
| 1996 | 0.0 | 0.0 | 0.0 | 0.0 | 0.0 | 0.0 | 0.0 | 0.0 | 0.0 | 0.0 | 1.0 |
| 1995 | 0.0 | 0.0 | 0.0 | 1.0 | 0.0 | 0.0 | 0.0 | 0.0 | 0.0 | 0.0 | 0.0 |
| 1994 | 0.0 | 0.0 | 0.0 | 0.0 | 0.0 | 0.0 | 0.0 | 0.0 | 0.0 | 0.0 | 0.0 |
| 1993 | 0.0 | 0.0 | 0.0 | 0.0 | 0.0 | 0.0 | 0.0 | 0.0 | 0.0 | 1.0 | 0.0 |
| 1992 | 0.0 | 0.0 | 0.0 | 0.0 | 0.0 | 0.0 | 0.0 | 1.0 | 0.0 | 0.0 | 0.0 |
| 1991 | 0.0 | 0.0 | 0.0 | 0.0 | 0.0 | 0.0 | 0.0 | 1.0 | 1.0 | 0.0 | 0.0 |
| 1990 | 0.0 | 0.0 | 0.0 | 0.0 | 0.0 | 0.0 | 0.0 | 0.0 | 0.0 | 3.0 | 0.0 |
| 1989 | 0.0 | 0.0 | 0.0 | 0.0 | 0.0 | 0.0 | 0.0 | 2.0 | 1.0 | 2.0 | 0.0 |
| 1988 | 0.0 | 0.0 | 0.0 | 0.0 | 0.0 | 0.0 | 0.0 | 0.0 | 0.0 | 2.0 | 0.0 |
| 1987 | 0.0 | 0.0 | 0.0 | 0.0 | 1.0 | 0.0 | 0.0 | 5.0 | 9.0 | 3.0 | 0.0 |
| 1986 | 0.0 | 0.0 | 0.0 | 0.0 | 0.0 | 0.0 | 0.0 | 0.0 | 0.0 | 0.0 | 0.0 |
| 1985 | 0.0 | 0.0 | 0.0 | 0.0 | 0.0 | 0.0 | 0.0 | 0.0 | 0.0 | 0.0 | 0.0 |
| 1984 | 0.0 | 0.0 | 0.0 | 0.0 | 0.0 | 0.0 | 0.0 | 0.0 | 0.0 | 0.0 | 0.0 |
| 1983 | 0.0 | 0.0 | 0.0 | 0.0 | 0.0 | 0.0 | 0.0 | 0.0 | 0.0 | 0.0 | 0.0 |
| 1982 | 0.0 | 0.0 | 0.0 | 0.0 | 0.0 | 0.0 | 0.0 | 0.0 | 0.0 | 0.0 | 0.0 |
Distribution map
Distribution - 2017
This map shows the observed distribution of the Rock Dove for 2017.
The red circles are the grid cells where Rock Dove have been reported.
The transparency of the red circles indicate how many surveys sheets were submitted for that grid cell; the darker the red the more reliable the data. Of the 315 grid cells with reports, 83 had only one sheet; an example is grid number A11.
The size of the circle represents the reporting rate. The maximum reporting rate for Rock Dove was 35.9% (eg grid number L13) and the minimum was 0.5% (eg grid number Q13). 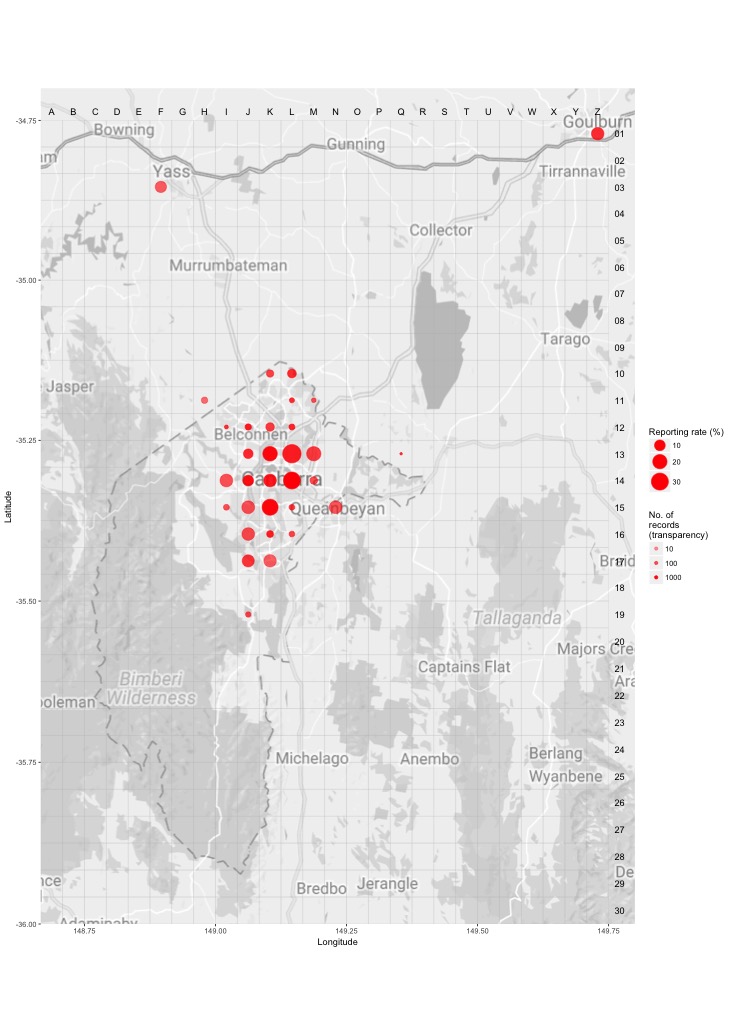
Distribution - all years
This map shows the observed distribution of the Rock Dove for all years.
The red circles are the grid cells where Rock Dove have been reported.
The transparency of the red circles indicate how many surveys sheets were submitted for that grid cell; the darker the red the more reliable the data. Of the 703 grid cells with reports, 55 had only one sheet; an example is grid number A12.
The size of the circle represents the reporting rate. The maximum reporting rate for Rock Dove was 50.0% (eg grid number Y17) and the minimum was 0.1% (eg grid number M11). 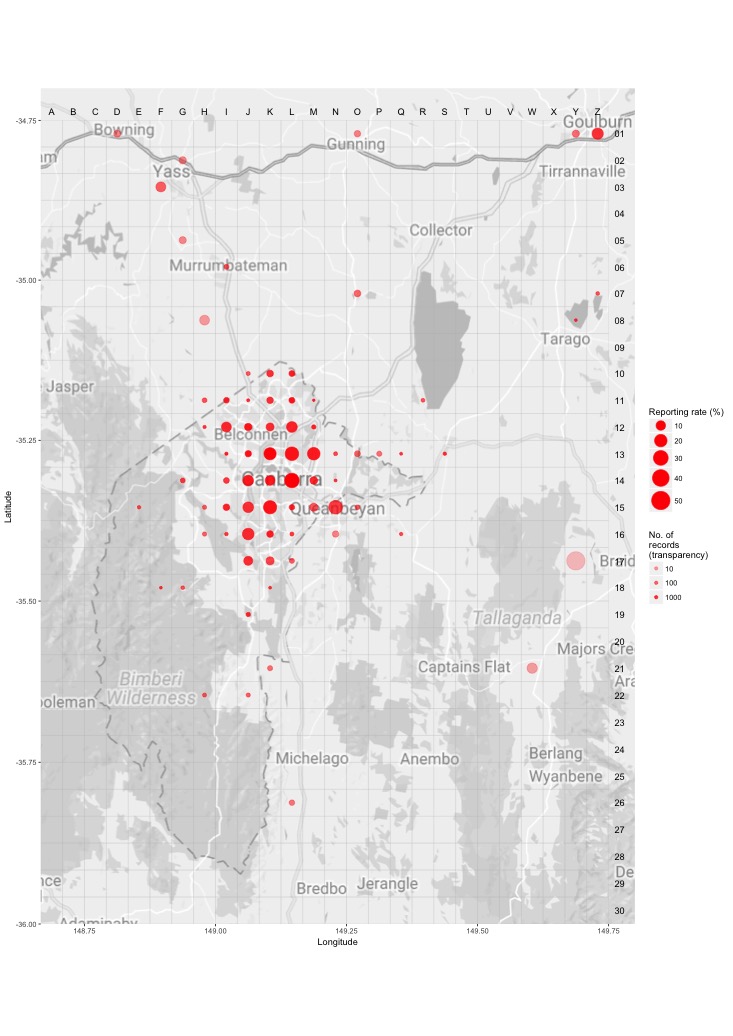
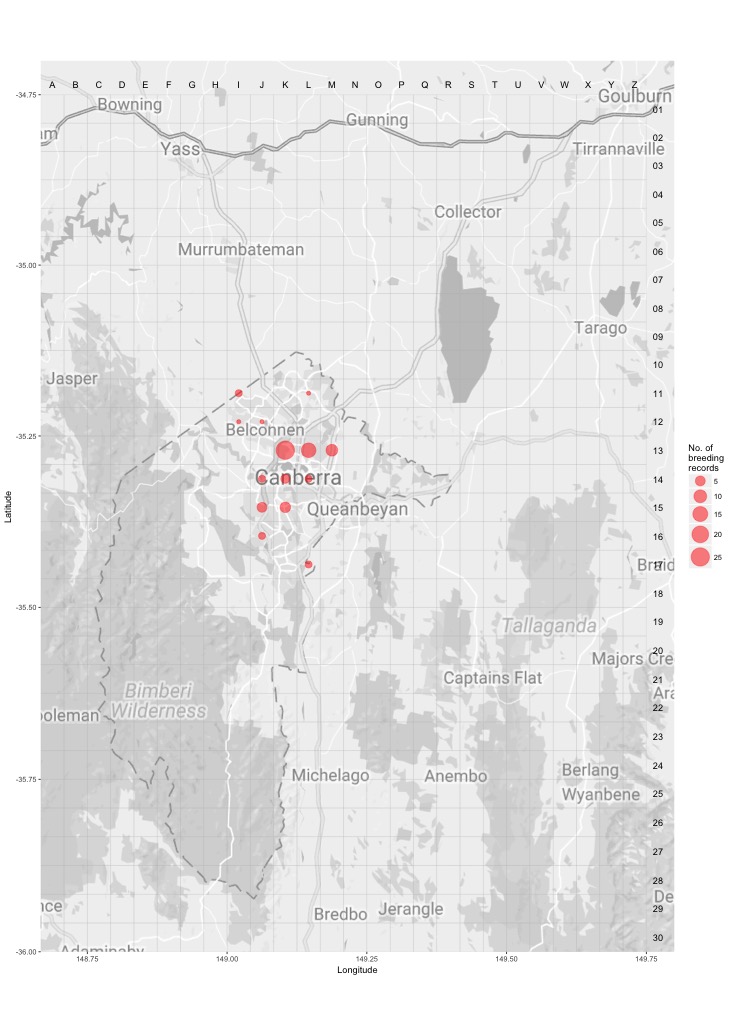
Breeding map
Breeding - 2017
This map shows the breeding distribution of the Rock Dove for 2017.
The red circles are the grid cells where breeding activity for Rock Dove have been reported.
The size of the circle represents the number of reports. 
Breeding - all years
This map shows the breeding distribution of the Rock Dove for all years.
The red circles are the grid cells where breeding activity for Rock Dove have been reported.
The size of the circle represents the number of reports.